Food Prices and Seasonal Fluctuations
Understand why food costs rise and fall throughout the year, from harvest season impacts to monsoon effects on supply chains across Malaysia.
Read MoreUnderstanding the Consumer Price Index methodology, data collection processes, and what inflation numbers really mean for your wallet
Every month, statisticians across Malaysia track thousands of products — from a loaf of bread in Kuala Lumpur to a tank of petrol in Penang. They’re collecting data for something called the Consumer Price Index, or CPI. It’s how we measure inflation and understand whether things are getting more expensive.
But here’s the thing: CPI isn’t magic. It’s a carefully constructed measurement built on sampling, weighting, and calculations. And if you’re wondering why your grocery bills feel heavier even when CPI shows “only 2% inflation,” understanding how CPI actually works helps explain the gap between statistics and reality.

Malaysia’s CPI doesn’t measure the price of every single product in every shop. That’d be impossible. Instead, statisticians use something called a “basket of goods” — a carefully selected sample of products that represent what average households actually buy.
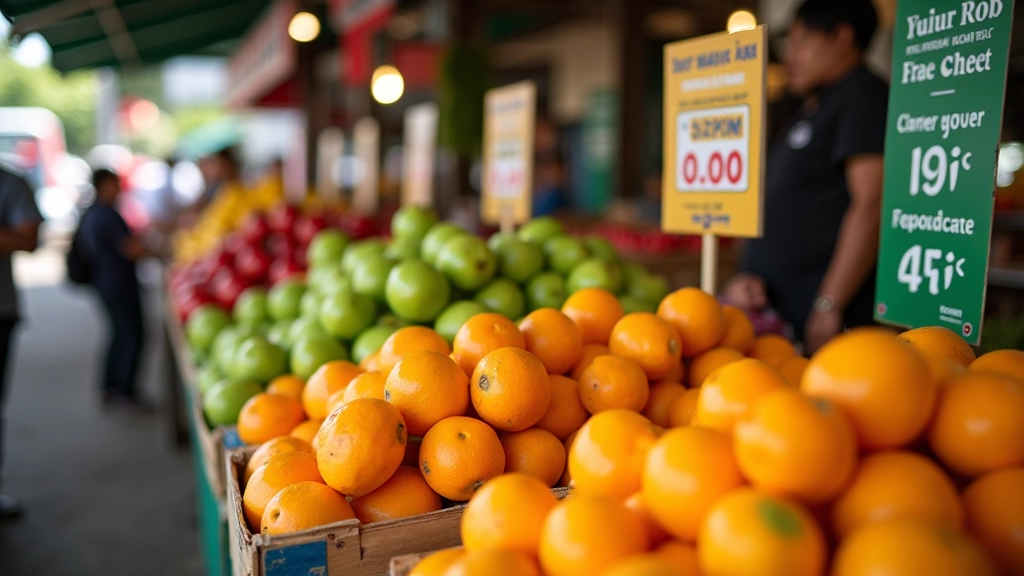
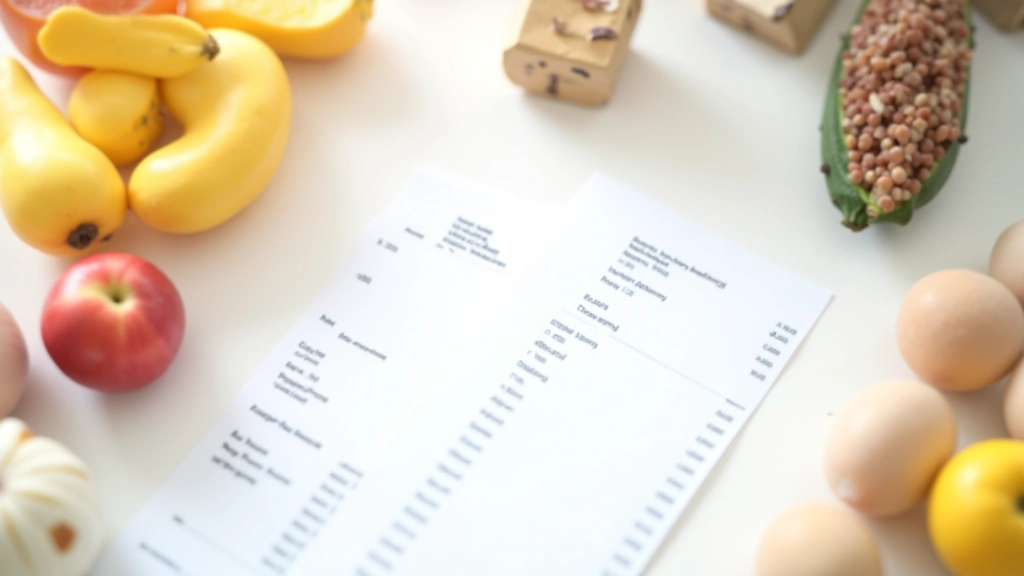
This basket includes eight major categories: food and non-alcoholic beverages, alcoholic beverages and tobacco, clothing and footwear, housing and utilities, furnishings and household maintenance, health, transport, and recreation and culture. Within each category, they track specific items. In the food section, for example, they’re monitoring prices for rice, chicken, cooking oil, and eggs — the things Malaysians actually put in their shopping carts regularly.
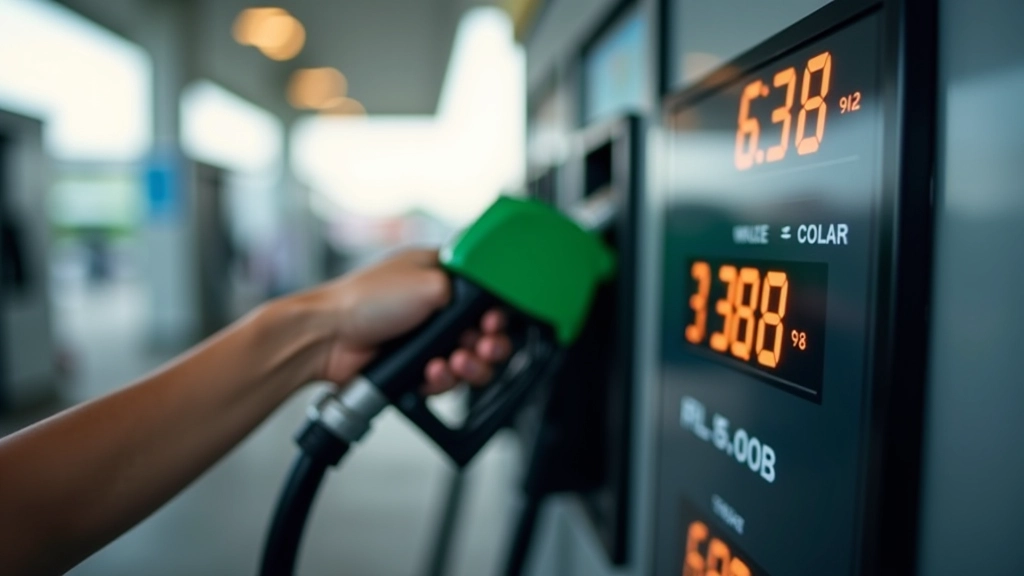
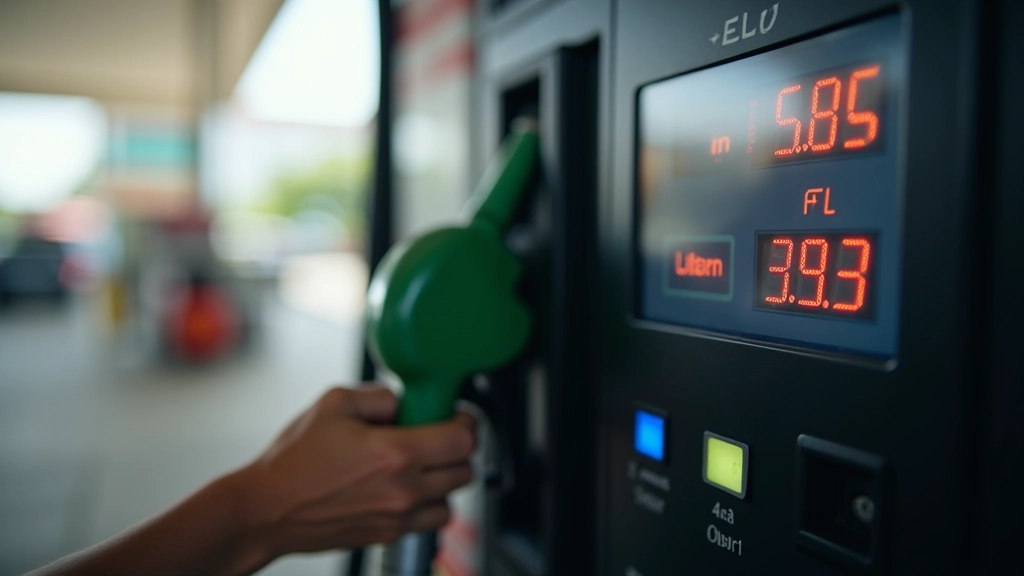
The clever part? These items aren’t weighted equally. A rise in petrol prices matters more to the overall index than a rise in umbrella prices because more households spend more on fuel. Transport makes up about 17% of the index, while clothing is roughly 5%. These weights reflect how Malaysians actually spend their money.


Field enumerators — trained staff working for Malaysia’s Department of Statistics — visit retail outlets across the country. They’re not just popping in once. They’re tracking the same products at the same stores month after month, recording exact prices for everything from a kilogram of rice to a pair of shoes.
The sampling strategy matters here too. They don’t just monitor shops in Bangsar or Petaling Jaya. They collect data from major supermarkets, wet markets, small neighborhood shops, and standalone retailers across all regions — urban and rural. This geographic spread ensures the index reflects price changes affecting people nationwide, not just city dwellers.
These days, much of the collection happens digitally. Enumerators use tablets and apps to record prices in real-time, which gets uploaded directly to the statistical office. It’s faster than the old clipboard method and reduces transcription errors. But the principle stays the same: systematic, repeated measurement of actual market prices.
Once the data comes in, statisticians perform several steps to arrive at the CPI figure you see in news headlines. First, they calculate the average price for each item in the basket across all the locations sampled. Then they compare that month’s price to a base period — Malaysia uses 2010 as the reference year, set at 100.
So if rice cost RM 2 in 2010 and now costs RM 2.40, the index for rice would be 120 (a 20% increase). But they don’t report individual item indices. Instead, they aggregate everything using those weights we mentioned earlier. A 20% jump in petrol (17% weight) impacts the overall index more than a 20% jump in clothing (5% weight).
CPI = (Sum of [Current Price Weight] for all items) (Sum of [Base Period Price Weight] for all items) 100
When this calculation comes out to 125, it means consumer prices are 25% higher than they were in the base period.

You’ve probably noticed this disconnect. CPI says inflation is 2-3%, but your grocery bill feels like it’s jumped 10%. There are several reasons why personal experience differs from the official index:
The national CPI basket reflects average household spending. But you’re not average. If you eat more chicken than the basket assumes, or if you drive less and use public transport more, your personal inflation rate differs from the official number.
Prices in Kuala Lumpur often differ from prices in Kelantan or Labuan. The national CPI smooths these differences. You’re experiencing your local inflation, which might be higher or lower than the national average.
When a product improves — like phones getting better cameras — statisticians adjust the price to account for added value. Your perception of “price increase” doesn’t make this adjustment, making increases feel larger.
When chicken prices spike, you might switch to fish. The CPI acknowledges some substitution, but not perfectly. It captures the friction of these real-world adjustments less than you experience them.
Malaysia’s fuel subsidy rationalization has made CPI tracking more interesting. When the government reduces fuel subsidies, petrol prices jump at the pump — this shows up immediately in CPI calculations. But the underlying economic cost of fuel didn’t change; what changed was how much consumers versus taxpayers pay for it.
This is why the Department of Statistics publishes two versions of CPI: one including price changes from subsidy adjustments, and one excluding them. The “core CPI” (excluding volatile food and energy) gives policymakers a clearer picture of underlying inflation trends versus temporary price shocks.
CPI isn’t perfect, but it’s remarkably useful. It’s a consistent, scientifically designed measure that lets us track inflation over time and compare it across countries. When you see that Malaysia’s inflation hit 2.1% in a particular month, you’re looking at the result of thousands of price observations, carefully weighted and calculated.
The methodology — sampling, weighting, base-period comparison, and adjustment for quality changes — makes CPI reliable for understanding broad economic trends. But it’s not meant to capture your individual experience. Your personal inflation rate depends on what you buy, where you live, and how your consumption patterns differ from the national average.
Next time you see an inflation figure in the news, you’ll know it represents months of fieldwork, statistical expertise, and careful calculation. It’s data worth understanding, even if it doesn’t perfectly match what you see at the supermarket checkout.
The Department of Statistics publishes detailed CPI breakdowns by region and category on their website, updated monthly. These show exactly which product categories are driving inflation — food, transport, housing — helping you understand where price pressures are actually hitting hardest.

This article provides educational information about how the Consumer Price Index is calculated and methodology in Malaysia. It’s based on publicly available data from the Department of Statistics Malaysia. CPI figures and methodologies can change, and this content represents information current as of March 2026. For official, up-to-date CPI data and detailed statistical reports, please visit the Department of Statistics Malaysia website directly. This information is intended for educational purposes and should not be taken as financial advice or economic forecasting.